
Risk Overview
Seven-day Weather Risk Overview
The graphic shows the daily risk summary for 7 days. Daily risk is based on highest risk factor for that day.
|
|
|
|
|
|
|
|
|
|---|---|---|---|---|---|---|---|
| risk level |
|
|
|
|
|
|
|
table legend
No risk
Low risk
High risk
Risk Factors
The graphic shows the weather factors that have some risk for the next 7 days. Click on the colored boxes to see what the risk factors is based on and what impact it may have.
| Extreme Heat Risk |
Extreme Heat Risk: risk level 0
|
Extreme Heat Risk: risk level 0
|
Extreme Heat Risk: risk level 0
|
Extreme Heat Risk: risk level 0
|
Extreme Heat Risk: risk level 0
|
|
|
|---|---|---|---|---|---|---|---|
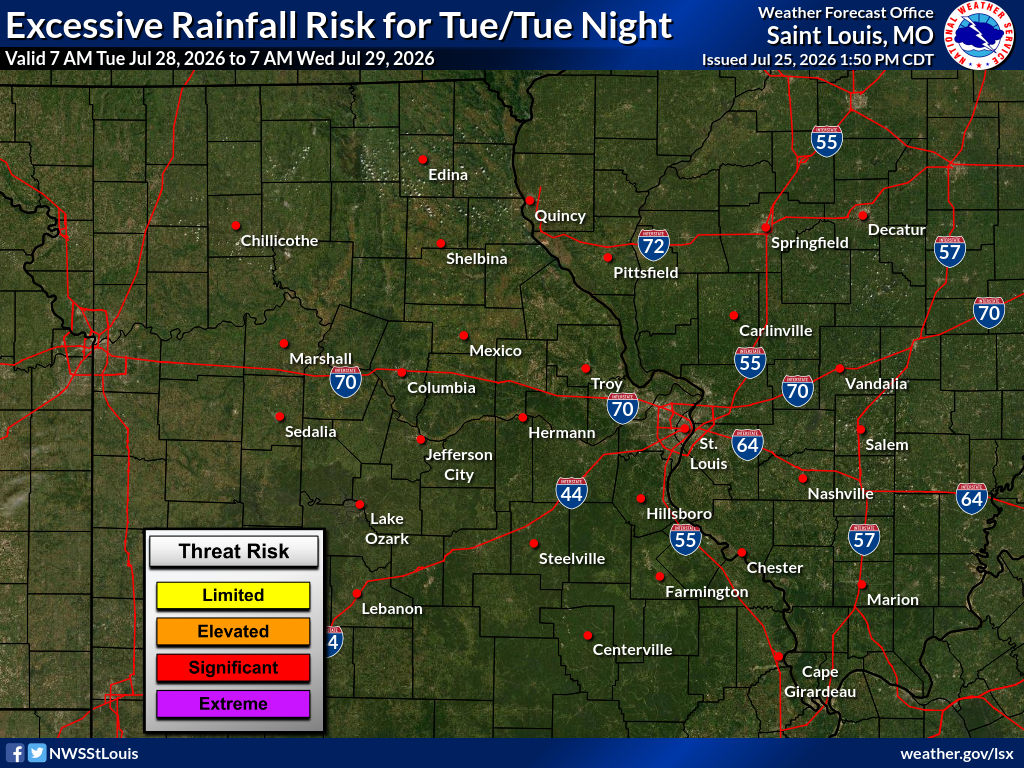
| Excessive Rainfall Risk |
Excessive Rainfall Risk: risk level 0
|
Excessive Rainfall Risk: risk level 0
|
Excessive Rainfall Risk: risk level 0
|
|
|
Excessive Rainfall Risk: risk level 0
|
Excessive Rainfall Risk: risk level 0
|
| Lightning Risk |
Lightning Risk: risk level 0
|
Lightning Risk: risk level 0
|
Lightning Risk: risk level 0
|
|
|
Lightning Risk: risk level 0
|
Lightning Risk: risk level 0
|
| Fire Weather Risk |
Fire Weather Risk: risk level 0
|
Fire Weather Risk: risk level 0
|
Fire Weather Risk: risk level 0
|
Fire Weather Risk: risk level 0
|
Fire Weather Risk: risk level 0
|
Fire Weather Risk: risk level 0
|
|
No impact in 8 other categories: Severe Thunderstorm Risk, Tornado Risk, Thunderstorm Wind Risk, Hail Risk, Spotter Outlook, Wind Risk, Fog Risk, Extreme Cold Risk
Sunday: Extreme Heat Risk
3: Significant
Heat exhaustion or heat stroke likely with prolonged exposure.
Determining Risk
We base this risk on local weather office temperature and/or heat index forecasts.
Risk Map

Risk Levels
| risk level name | risk level description |
|---|---|
|
1:Limited
|
Heat exhaustion possible with prolonged exposure. |
|
2:Elevated
|
Heat exhaustion likely with prolonged exposure. Heat stroke possible. |
|
3:Significant
|
Heat exhaustion or heat stroke likely with prolonged exposure. |
|
4:Extreme
|
Dangerously hot conditions could quickly result in heat exhaustion or heat stroke. |


Loading the risk data......